Prism
Each panel of the sculpture presented a different live feed, from transport information from TFL, environmental data from CASA, to live energy usage from Carbon Culture.


Source: Prism | KEIICHI MATSUDA
LINKSCALE

LINKSCALE | Maj Plemenitas | Award winning | Cross Scale Design | Architecture | Innovation | Design | Research |Bartlett | UCL | Academic | Author
Source: LINKSCALE | Maj Plemenitas
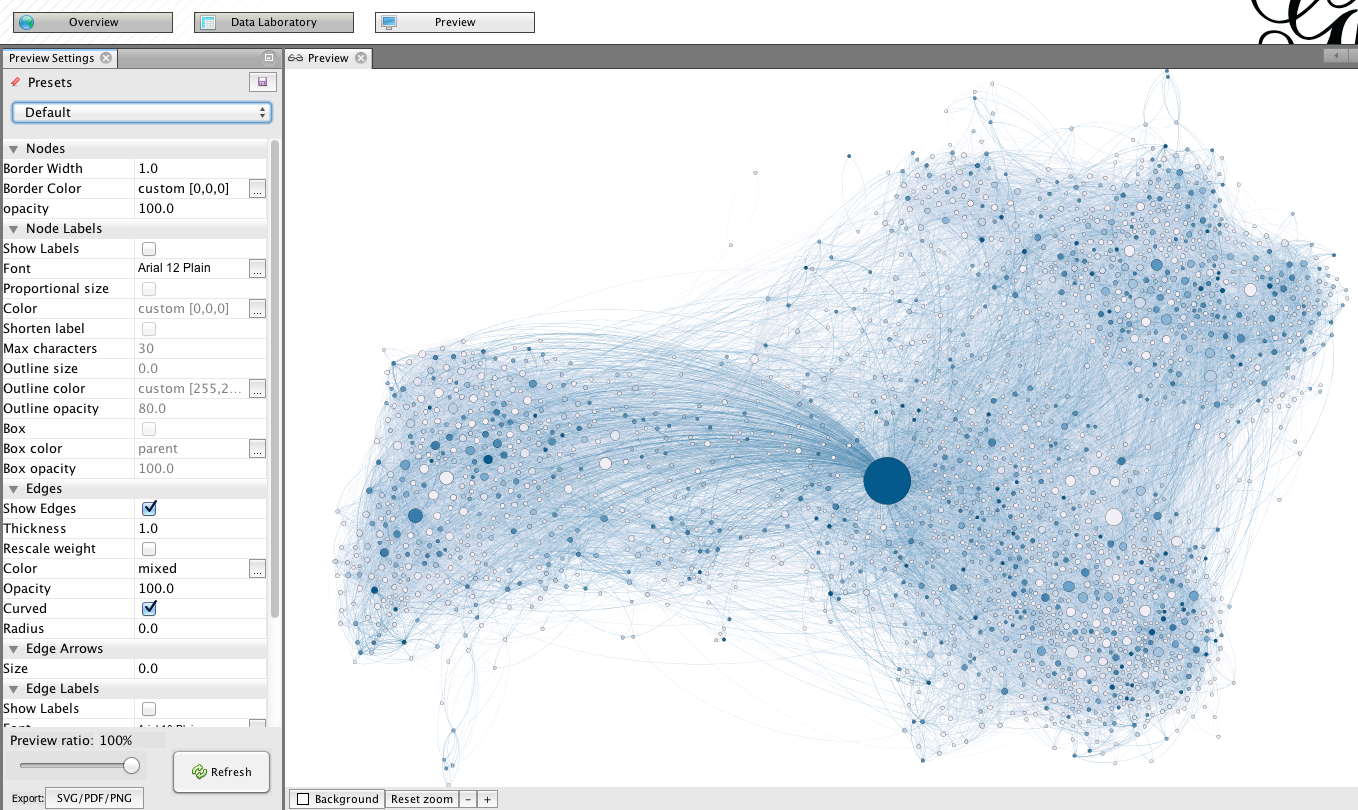
Visualization with GEPHI
Network Analysis appears to be an interesting tool to give the researcher the ability to see its data from a new angle. Because Gephi is an easy access and powerful network analysis tool, here is a tutorial that should allow everyone to make his first experiments.